Introduction
Nanoparticle tracking analysis (NTA) provides single particle size and concentration measurements. The growing popularity of the technique has driven the requirement to reduce user input, reduce variability and provide interlaboratory consistency in size and concentration measurements. The NTA concentration measurement has been modified to provide improved accuracy, precision and reproducibility of concentration measurements on a range of nanoparticle types, covering a broad size and concentration range. Concentration measurement repeatability and reproducibility have been greatly increased whilst removing measurement sensitivity to user settings over the recommended concentration range for NTA analysis.Nanoparticle Tracking Analysis (NTA) Overview
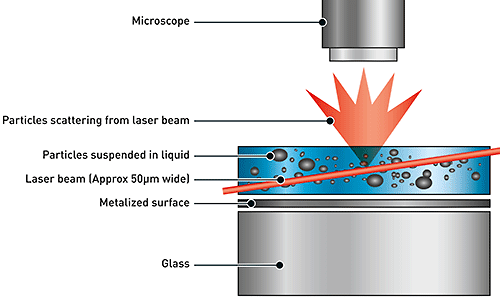
NTA utilizes the properties of both light scattering and Brownian motion in order to obtain the particle size distribution of samples in liquid suspension. A laser beam is passed through the sample chamber, and the particles in suspension in the path of this beam scatter light in such a manner that they can easily be visualized via a 20x magnification microscope onto which is mounted a camera. The camera, which operates at approximately 30 frames per second (fps), captures a video file of the particles moving under Brownian motion within the field of view of the camera (Figure 1).
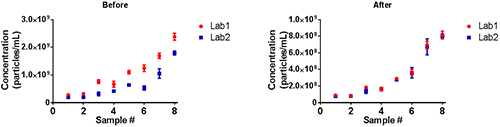
The movement of the particles is captured on a frame-by-frame basis. The proprietary NTA software simultaneously identifies and tracks the center of each of the observed particles, and determines the average distance moved by each particle in the x and y planes. This value allows the particle diffusion coefficient (Dt) to be determined from which, if the sample temperature T and solvent viscosity η are known, the sphere-equivalent hydrodynamic diameter, d, of the particles can be identified using the Stokes-Einstein equation (Equation 1).
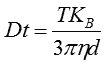
NTA is not an ensemble technique interrogating a very large number of particles, but rather each particle is sized individually, irrespective of the others. An example of the size distribution profile generated by NTA is shown in Figure 2.
In addition, because NTA can measure particle by particle the number of particles within the field of view is known. Whilst standard NTA measurements use a fixed field of view (approximately 100 μm by 80 μm) illuminated by a beam approximately 10 μm in depth allowing a scattering volume of the sample to be estimated. The new NTA concentration measurement upgrade reduces the influence of both capture and analysis settings on the concentration result, giving more accurate, precise and repeatable concentration values.
Results
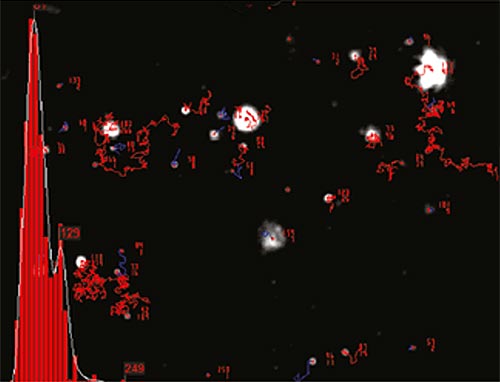
Concentration measurement accuracy has been shown to increase significantly when using the NTA Concentration Measurement Upgrade, as has inter-laboratory precision (Figure 3). Identical samples were analysed at user selected settings on two different NS500 instruments in 2 different laboratories. Before the NTA concentration measurement upgrade was applied results from the two laboratories varied significantly, especially at higher concentration levels. After the upgrade is applied the reproducibility between the two labs is greatly improved and the accuracy of the measurement to the sample concentration is also significantly improved.
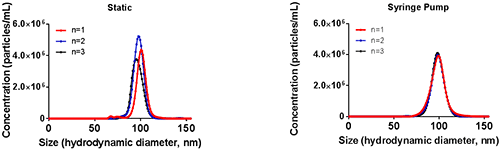
The use of the NTA syringe pump has also been shown to help drive down variation between measurements whilst improving both sizing and concentration repeatability. An example of the improvements seen with the use of the NTA syringe pump is shown in Figure 4 where a sample of 100nm polystyrene standards was analysed using either static (no syringe pump) or flow (with syringe pump) measurements with the same capture and analysis settings.
a.
b.

A protocol for sample delivery and measurement has been developed which has contributed to improvements in precision. These combined steps provide repeatability values as low as 3 % (cv). Measurements of dilution linearity can provide accurate results with an error as low as 13 % across a concentration range of 1x10⁶ – 1x10⁹ particles per ml (subject to particle size and refractive index).
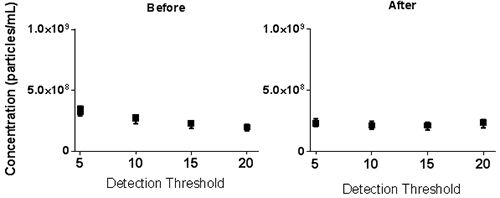
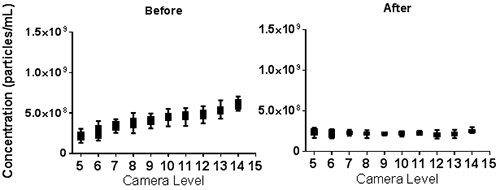
The NTA Concentration Measurement Upgrade reduces the susceptibility of the concentration measurement to user settings (camera level and detection threshold) as shown in Figure 5. Samples recorded at different camera levels were analysed over a range of detection thresholds. Whereas before the NTA concentration measurement upgrade concentration results varied with chosen detection threshold, after the upgrade the results are comparable over the range of detection thresholds tested. Results recorded at different camera levels but analysed at the same detection threshold again show variation in concentration before the upgrade is applied but this variation is greatly reduced with the application of the upgrade.
a.
b.
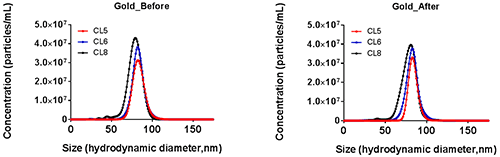
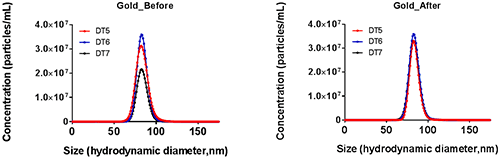
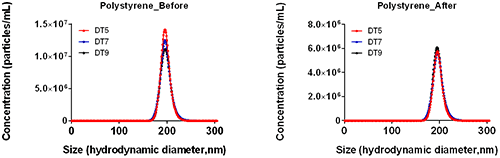
Whilst total particle concentration has been shown to vary (Figure 5) as a result of user settings before the upgrade is applied the overall distribution also shows reduced variation upon upgrade application (Figure 6). This reduction has been seen over a range of particle sizes, concentrations and materials.
a.
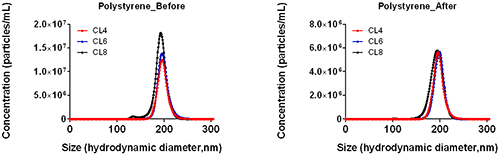
b.
The study of extracellular vesicles is an area that has become the subject of intense study and research in recent years. These vesicles are apparently ubiquitous in a broad range of prokaryotic and eukaryotic organisms and it is believed they have a wide role to play in many physiological and pathological processes. They are typically described either as exosomes which are produced from the cell endosome or microvesicles, produced by cell membrane budding. Their cellular origin, structure, functions and characterization are still the subject of much debate. Also debated by the research community are the size of such vesicles though exosomes are agreed to be smaller in size (typically 100 nm in diameter or smaller) whilst micro vesicles are larger (typically described as being up to 1 µm in diameter).
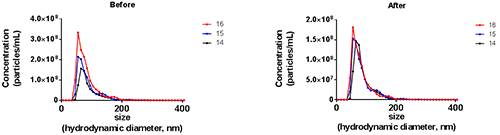
The NTA Concentration Measurement Upgrade has also been shown to improve the accuracy and precision of concentration measurements on non-standard samples including exosomes and microvesicles (Figure 7). In this exosome example, different users typically selected camera level 14, 15 or 16. The application of the upgrade has been shown to increase the repeatability of measurement at different camera levels whilst reducing setting induced differences.
Conclusion
The NTA concentration measurement upgrade has been shown to improve both the accuracy and precision of concentration measurements over a wide range of sample sizes, concentrations and materials. The inter- and intra- laboratory repeatability and reproducibility are greatly improved with the application of the upgrade, which has also been shown to reduce the influence of user selected capture and analysis settings on measurements. The use of a NTA syringe pump significantly increases the accuracy, precision and repeatability of both size and concentration measurement and the upgrade has also been shown to positively benefit concentration measurements of non-standard sample types such as exosomes and microvesicles.
This project has received funding from the European Union’s Seventh Programme for research, technological development and demonstration under grant agreement No 604347.
Malvern Instruments provides the materials and biophysical characterization technology and expertise that enable scientists and engineers to understand and control the properties of dispersed systems. These systems range from proteins and polymers in solution, particle and nanoparticle suspensions and emulsions, through to sprays and aerosols, industrial bulk powders and high concentration slurries. Used at all stages of research, development and manufacturing, Malvern’s materials characterization instruments provide critical information that helps accelerate research and product development, enhance and maintain product quality and optimize process efficiency. Our products reflect Malvern’s drive to exploit the latest technological innovations and our commitment to maximizing the potential of established techniques. They are used by both industry and academia, in sectors ranging from pharmaceuticals and biopharmaceuticals to bulk chemicals, cement, plastics and polymers, energy and the environment. Malvern systems are used to measure particle size, particle shape, zeta potential, protein charge, molecular weight, mass, size and conformation, rheological properties and for chemical identification, advancing the understanding of dispersed systems across many different industries and applications. Headquartered in Malvern, UK, Malvern Instruments has subsidiary organizations in all major European markets, North America, Mexico, China, Japan and Korea, a joint venture in India, a global distributor network and applications laboratories around the world. www.malvern.com severine.michel@malvern.com
Newsletters
Receive the latest pharmaceutical news, personalities, education, and career development – weekly to your inbox.