Until now Protein/Protein interactions have been disrupted or replaced by other proteins. For example, antibodies or chimeric constructs are used to inhibit ligand/receptor interactions, and recombinant proteins are used as substitutes for deficient or insufficient natural proteins. The use of small molecules as antagonists or agonists of protein/protein interactions is still in its early days. The successful targeting of protein/protein interactions requires a precise characterization of the protein partners, their interaction and the allosteric consequences of that interaction. As illustrated in this chapter, Microcalorimetry is ideally suited to perform this characterization.
Introduction
Protein/Protein interactions define a large fraction of the validated targets for drug development including cancer, inflammation, diabetes, osteoporosis, infection and autoimmune diseases. Until now Protein/Protein interactions have been disrupted or replaced by other proteins. For example, antibodies or chimeric constructs are used to inhibit ligand/receptor interactions, and recombinant proteins are used as substitutes for deficient or insufficient natural proteins. The use of small molecules as antagonists or agonists of protein/protein interactions is still in its early days. The successful targeting of protein/protein interactions requires a precise characterization of the protein partners, their interaction and the allosteric consequences of that interaction. As illustrated in this chapter, Microcalorimetry is ideally suited to perform this characterization.The energetics of protein folding
Ever since the pioneering work of Privalov in the seventies,1-4 differential scanning calorimetry (DSC) has been used to determine the magnitude of the forces that stabilize the native structure of proteins. After proper data processing, the quantity measured in DSC is the heat capacity of a protein as a function of temperature. Figure 1 below shows a typical scan of a monomeric globular protein that undergoes a two-state transition (more complex transitions like multistate or irreversible denaturation can also be accurately treated).5-8 The disruption of interactions in the protein gives rise to an endothermic denaturation peak with its maximum value centered at the transition temperature, Tm, which often is used as a measure of protein stability. The graph shows the typical sigmoidal shift in baseline to a higher heat capacity at the completion of the denaturation. The enthalpy, ΔH, associated with the process corresponds to the area under the curve after subtraction of the sigmoidal baseline. The unfavorable enthalpy of transition is opposed by the large favorable entropy change, ΔS, associated with the increase in degrees of freedom gained when the restricted amino acids become unfolded. This conformational entropy increase is large enough to also overcome the unfavorable solvation entropy associated with the hydration of the protein core upon unfolding. Furthermore, when the hydrophobic residues become exposed, water molecules form a highly structured hydration layer with a high heat capacity. The sigmoidal baseline change for the denaturation corresponds to this large and positive change in heat capacity, ΔCp. As a consequence of the large value for the change in heat capacity, both the enthalpy and the entropy changes for protein denaturation depend strongly on temperature. The inset in Figure 1 shows the relation between enthalpy and temperature.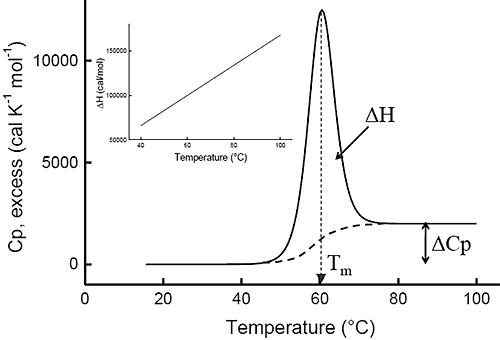
Figure 1: Typical DSC curve for a monomeric globular protein in solution that undergoes a two-state transition The enthalpy, ΔH, corresponds to the area under the curve obtained after subtraction of the sigmoidal change in heat capacity, ΔCp. Tm is the transition temperature. The values used in the simulation were ΔH = 100 kcal/mol, Tm = 60°C and ΔCp = 2 kcal/(K • mol). The inset shows the denaturation enthalpy as a function of temperature. The slope is also equal to the ΔCp for the transition.
The stability of the native state of a protein is dictated by the magnitude of its Gibbs energy (ΔG) which is given by the standard thermodynamic expression:

Equation 1 where ΔH and ΔS are the enthalpy and entropy changes respectively. In this chapter we will follow the common practice of using the native state as the reference state. Since both, the enthalpy and entropy changes are not constants but increasing functions of temperature, the Gibbs energy of stabilization of a protein needs to be written as:

Equation 2 where TR is a convenient reference temperature, ΔCp is the heat capacity change, and ΔH(TR) and ΔS(TR) are the enthalpy and entropy values at that temperature. Because 60°C (333.15 K) is close to the median denaturation temperature of proteins, it has been chosen as a convenient reference temperature for comparing several proteins since that reference temperature minimizes extrapolation errors.
Common features of protein energetics
The energetics associated with the folding/unfolding of globular proteins exhibits great regularity, reflecting the common nature of the forces that stabilize the native structure. When the enthalpy change for different globular proteins is compared at 60°C, a clear correlation is seen between the enthalpy change and the size of the protein (number of residues). This phenomenon is illustrated in Figure 2 and provides an important benchmark for the interpretation of thermodynamic data for novel proteins. For example, a smaller enthalpy change than the one expected for a given size is an indication that the protein might have unstructured regions.
Figure 2: The change in enthalpy at 60°C upon unfolding for different globular proteins as a function of the number of residues. The experimental values were taken from the compilation made by Robertson and Murphy27 and experimental values from this laboratory. Upon protein unfolding, the major contribution to the enthalpy change arises from the disruption of intramolecular interactions (van der Waals, hydrogen bonds, etc.) and the parallel solvation of the interacting groups. On average, those contributions are similar for different globular proteins and therefore scale in terms of size. Minor contributions, like those associated with protonation/deprotonation processes are not sufficiently large to account for large deviations in the magnitude of the enthalpy or entropy changes. The change in heat capacity upon unfolding is also correlated with the size of the protein as seen in Figure 3.
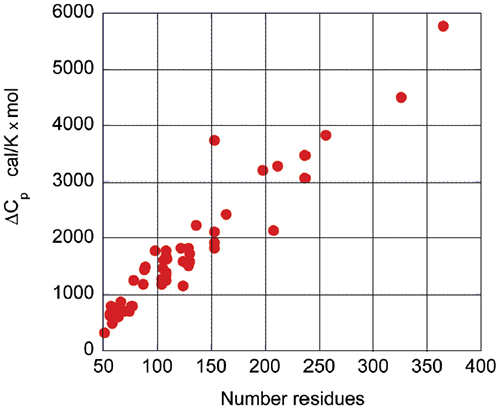
Figure 3: The change in heat capacity upon unfolding for different globular proteins as a function of the number of residues. The experimental values were taken from the compilation made by Robertson and Murphy27 and experimental values from this laboratory. The heat capacity change is mainly the result of changes in hydration of groups that are buried from the solvent in the native state and become solvent exposed upon unfolding. It has been known for many years that changes in heat capacity associated with hydration are local in nature and scale in terms of the changes in the surface area accessible to the solvent.9-12 For globular proteins, the surface area that becomes buried in the native state is proportional to the number of residues in the protein. Thus, the enthalpy and the heat capacity changes can be used to evaluate the level of structure in a protein. One of the most notable cases reported in the literature corresponds to the HIV-1 envelope glycoprotein gp120 (Ref13 and unpublished work from this laboratory). gp120 is a protein of about 500 amino acids that undergoes a two-state unfolding with a Tm of 59.2°C, a value close to that expected for an average globular protein. The enthalpy change associated with the transition is 180 kcal/mol, which translates to a value of only 2.3 cal/g. This is less than half the expected value for the average globular protein at the same temperature, and corresponds to the unfolding of a protein of about 300 residues. The Tm value and the cooperative two-state transition suggest that gp120 has a well-structured core and regions of very low structure that do not contribute to the enthalpy of the unfolding process.
The quality of recombinant proteins
Before a molecular interpretation of the thermodynamic parameters can be made, it is necessary to assess if the protein under study has the required quality for analysis. Here, DSC also plays a critical role. A well-characterized protein batch may serve as reference for evaluating the quality of future batches. High quality recombinant proteins need to be not only free of impurities but also free of misfolded, denatured or partially denatured forms of the same protein. Conventional analytical techniques like gel electrophoresis, light scattering or mass spectrometry will not detect or quantitate misfolded protein forms in solution. For enzymes, specific acitivity measurements or active site titrations can evaluate the population of inactive forms, however for proteins that lack enzymatic activity this is a difficult task. Usually, the protein needs to be characterized simultaneously by several techniques including chromatography, electrophoresis, mass spectrometry, NMR, DSC, etc. Once a high quality, well characterized protein is obtained, it can serve as a standard. DSC provides an effective and rapid way to accurately evaluate a protein batch by comparison with the standard.The DSC of a well characterized protein batch (the standard) will be characterized by three different parameters: 1) The Tm or location of the peak maximum; 2) The enthalpy or area under the curve; and, 3) The shape of the curve. For a new protein batch to be of the same quality, it should match the standard in those three parameters. The Tm is sensitive to the presence of ligands or cofactors and, therefore, a Tm shift, up or down, may be indicative of the presence or absence of ligands or cofactors. The area under the curve is the best indicator of the presence or absence of denatured forms of the protein. A smaller area is a clear indication that not all the protein is correctly folded. In fact, the fraction of protein that is correctly folded can be estimated from the ratio of the areas measured for the new protein and the standard. The shape of the curve reflects the folding/unfolding mechanism, and consequently, the presence of partially folded forms that also undergo thermal denaturation will affect this shape. An example of DSC results obtained with different batches of gp120 is shown in Figure 4. The area under the curve for each batch is proportional to the fraction of gp120 that is correctly folded, and equal to the fraction that is able to bind CD4, as determined by ITC.
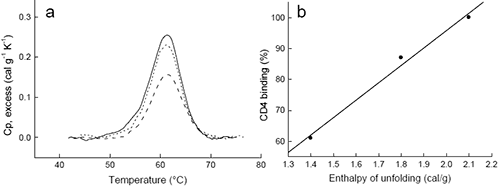
Figure 4: DSC can be used to assess the quality of recombinant proteins. Shown are DSC results for three different batches of gp120 (a). The area of each peak was integrated after normalization per gram and subtraction of the sigmoidal baseline. The area under the curve for each batch was 2.1 (solid), 1.8 (short dash) and 1.4 cal/g (long dash), respectively. The fraction of gp120 that binds to CD4, determined by ITC, correlates with the degree of correctly folded protein estimated at the ratio of the observed enthalpy to that of the standard (2.3 cal/g) (b). >> Download the full Application Note as PDF
Malvern Instruments provides the materials and biophysical characterization technology and expertise that enable scientists and engineers to understand and control the properties of dispersed systems. These systems range from proteins and polymers in solution, particle and nanoparticle suspensions and emulsions, through to sprays and aerosols, industrial bulk powders and high concentration slurries. Used at all stages of research, development and manufacturing, Malvern’s materials characterization instruments provide critical information that helps accelerate research and product development, enhance and maintain product quality and optimize process efficiency. Our products reflect Malvern’s drive to exploit the latest technological innovations and our commitment to maximizing the potential of established techniques. They are used by both industry and academia, in sectors ranging from pharmaceuticals and biopharmaceuticals to bulk chemicals, cement, plastics and polymers, energy and the environment. Malvern systems are used to measure particle size, particle shape, zeta potential, protein charge, molecular weight, mass, size and conformation, rheological properties and for chemical identification, advancing the understanding of dispersed systems across many different industries and applications. Headquartered in Malvern, UK, Malvern Instruments has subsidiary organizations in all major European markets, North America, Mexico, China, Japan and Korea, a joint venture in India, a global distributor network and applications laboratories around the world. www.malvern.com severine.michel@malvern.com
Newsletters
Receive the latest pharmaceutical news, personalities, education, and career development – weekly to your inbox.