The current work has shown that a combination of library screening, molecular modeling, analysis of structural, thermodynamic, and inhibition data provided a valuable tool for structure based drug design. Even when structural data are not available, thermodynamic data can provide insight into drug design but interpretation of thermodynamic data is more insightful when structural data are available. Some insight into drug design that thermodynamic data provide is intuitive to skilled medicinal chemists, but there are situations that are not apparent without thermodynamic measurements. This work used a combination of structural, thermodynamic, and inhibition data to design unique potent small molecule inhibitors of renin.
Introduction
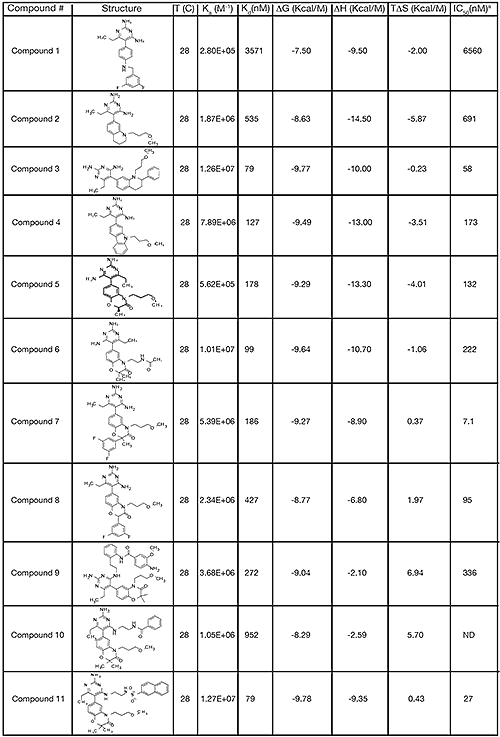
*Abbreviations used: NHANES, National Health and Nutrition Examination Survey; ACE, angiotensin-converting enzyme; ARB, angiotensin II receptor blocker; CHO, Chinese hamster ovary; DMEM, Dulbecco’s modified Eagle’s medium; FBS, fetal bovine serum; DMSO, dimethyl sulfoxide; MWCO, molecular weight cutoff; TPCK trypsin, N-tosyl-Lphenylalanine chloro-methyl ketone-trypsin; PEG, polyethylene glycol; ITC, isothermal titration calorimetry; S3sp, S3 subpocket; VDW, van der Waals. Analysis of data from the 1999-2002 National Health and Nutrition Examination Survey (NHANES)* indicated that an estimated 65 million individuals in the United States have hypertension.1 This analysis also determined that only 63.4% of the individuals sampled knew they were hypertensive, 45.3% were being treated, 29.3% had their blood pressure under control, but 70.7% of the total hypertensive population (~46 million people) did not1. Comparison of this data to earlier data indicated that since 1960 there have been improvements in awareness, treatment, and control of hypertension,2 but there is substantial room to improve both the identification of individuals at risk for hypertension and the treatment options. Current treatment options for hypertension range from lifestyle modifications, including lowering salt intake and reducing weight, to pharmaceutical intervention. Pharmaceutical therapies currently available include diuretics, alpha-blockers, alpha-beta-blockers, beta-blockers, calcium channel blockers, angiotensin-converting enzyme (ACE) inhibitors, and angiotensin II receptor blockers (ARB).3ACE inhibitors reduce blood pressure by inhibiting production of the potent vasoconstrictor angiotensin II and ARB inhibitors block binding of angiotensin II to the angiotensin receptor. Angiotensin II is produced in the final step of a two-step enzymatic cleavage of the glycoprotein angiotensinogen. In the first step, renin, an aspartyl protease, cleaves the decapeptide angiotensin I, from angiotensinogen. Then, ACE catalyzes a two residue cleavage of angiotensin I to form the octapeptide angiotensin II. Binding of angiotensin II to the angiotensin receptor initiates a cascade of events including vasoconstriction, and retention of sodium and water that can lead to hypertension. Inhibition of angiotensin II production thereby provides a rational opportunity for therapeutic treatment of hypertension. Several marketed medications inhibit production of angiotensin II through ACE inhibition and their clinical benefits have been reviewed.4 Except for dry cough reported in some treated patients,5 ACE inhibitors have been widely accepted based on good efficacy and safety profiles. While ACE inhibitors and many of the existing therapies are effective alone or in-combination, as previously mentioned, there remains a portion of hypertensive patients that do not attain the desired reduction in blood pressure or do not continue treatment due to undesired treatment effects. In addition, some hypertensive patients do not respond to a combination of treatments6 and opportunities remain for improved treatment options. Since ACE catalyzes the final step in the metabolic pathway of angiotensin II, inhibitors involved further up-stream in the metabolic pathway, such as renin inhibitors, have been sought to help reduce unwanted side effects. Many mechanistic studies of renin have been performed and the high-resolution structure of renin bound to substrate is known. Despite the wealth of information, developing functional nonpeptidic inhibitors of renin has proven challenging. Initial renin inhibitors were peptidic and suffered from rapid metabolic clearance and short plasma half-life. More recently some nonpeptidic inhibitors have been identified and, the renin inhibitor aliskiren, has completed Phase III clinical studies and has been submitted to the FDA for review.7 A high throughput screen for inhibitors of renin was performed at Pfizer that resulted in the identification of a unique nonpeptidic small molecule inhibitor with a diaminopyrimidine core. A round of parallel chemistry resulted in compound 1 that inhibited 50% of renin activity (IC50) in-vitro at a compound concentration of 6 μM. This was an improvement over the IC50 of 27 μM for the initial lead but increased potency was still required to be a viable drug candidate. Additional chemical modifications were done to the pyrimidine core to further optimize the lead and improve affinity for the substrate binding pocket.8-10 Many of the synthesized molecules were complexed with renin and crystallized. Detailed structural information on the binding of the lead to renin was obtained from X-ray crystallographic experiments. In addition, thermodynamics for the binding interactions were measured to determine the enthalpic and entropic contributions to binding affinity. Structural and thermodynamic information were then used in tandem to provide insights into the structure activity relationship for ligand interactions with the binding pockets. This combination of techniques was useful in building a unique nonpeptidic small molecule inhibitor of renin. Improved sensitivity, reliability, and ease of use of commercial micro-calorimeters11 has increased the use of thermodynamic information in inhibitor design. For example, thermodynamic evaluation of ligand binding interactions has been successfully used in the design of improved inhibitors of HIV protease.12;13 These studies showed that first generation protease inhibitors were largely entropically driven and lost significant inhibitory activity with mutations in the HIV protease. Subsequent generation inhibitors with enthalpically driven binding retained significant HIV protease inhibitory activity upon enzyme mutations. Enthalpically driven inhibitors were more flexible and able to accommodate protease mutations that left the sterically constrained first-generation inhibitors inactive.
Materials and methods
Human preprorenin clones Human preprorenin was cloned from Human Fetal Kidney Quick-Clone cDNA (Clontech, 7170-1). Preprorenin was cloned into pcDNA3.1(+) (Invitrogen, V790-20) at the BamHI and XbaI restriction sites. The clone was confirmed by sequencing and compared with the published human preprorenin sequence (Accession E01074). Transfection and antibiotic selection of CHO cells lines Transfection of Chinese hamster ovary (CHO) cells, cell type K1 (cat. no. CCL-61, American Type Culture Collection), was performed by using Effectene transfection reagent (cat. no. 301425, Qiagen). CHO cells, at 70% confluency, in a 150mm tissue culture dish (cat. no. 3025, Falcon) were used for each transfection. A standard transfection protocol employed 4 μg renin plasmid DNA and 120 μL Effectene reagent in a final volume of 20 mL of media. In addition, 0.4 μg of pcDNA6 V5/HisB plasmid was transfected with the renin plasmid so as to impart Blasticidin resistance. The transfection mixture remained on the cells overnight (~20 hrs). To establish a stable line, the transfected CHO cells were grown in Dulbecco’s modified Eagle’s medium (DMEM)-F12 selection media containing 500 μg/mL geneticin and 6 μg/mL blasticidin. Following approximately 10 days of selection pressure, the surviving cells formed distinct colonies. For clonal selection, flasks of cells were counted and then diluted to allow for plating of 1 cell/well using a 96-well plate format. Microscopic examination was used to determine wells containing single colonies. Expansion of each colony continued for about 7 days in a 96-well format. Each colony was expanded into subsequently larger wells. For long-term storage, cells were cryopreserved in 95% fetal bovine serum (FBS, cat. no.16000-036, Invitrogen) and 5% dimethyl sulfoxide (DMSO) following a standard procedure. Expression and purification of recombinant human rennin CHO cells expressing preprorenin were grown both batch wise and in perfusion mode in a basket bioreactor using serum free medium. Batch runs were seeded at 1 x 10⁵/ml and grown at 37°C for 6-7 days, reaching a density of about 1.5 x 10⁶/ml. Perfusion runs (3.5L bioreactor) were seeded with approximately 1 x 10⁹ cells, which were allowed to attach to polyester fiber disks contained in a basket within the bioreactor. The cells were grown at 37°C and reached a maximum density of 1.5 x 10¹¹ as estimated from glucose utilization. Fresh medium was perfused beginning at 72 hours at a rate of 2 L per day and gradually increased to a maximum of 20 L per day, with preprorenin being expressed for at least 38 days. The resulting secreted prorenin was glycosylated as indicated by mass spectrometry but the glycosylation state was not directly compared to native human prorenin. Purification was modified from [Ref14]. All steps were performed at 4°C unless otherwise noted. CHO media containing recombinant human prorenin was concentrated 150-fold using 10-kDa molecular weight cutoff (MWCO) ultrafiltration, and 40% saturated ammonium sulfate was added. The slurry was stirred overnight, and insoluble material was removed by centrifugation at 16,000g. The supernatant was buffer exchanged using 10-kDa MWCO ultrafiltration and loaded onto Blue Sepharose 6 Fast Flow (cat. no. 17-0948-02, GE Healthcare) in 20 mM Tris–HCl (pH 8.0) and 0.2 MNaCl. Prorenin was eluted with a linear gradient to 1.4 M NaCl and was buffer exchanged versus 20 mM Tris–HCl (pH 7.4) and 0.1 M NaCl. Prorenin was mixed with immobilized N-tosyl-L-phenylalanine chloromethyl ketone-trypsin (TPCK trypsin, cat. no. 20230, Pierce Biotechnology,) for 3 h at 200C. Mature renin was eluted and loaded onto Blue Sepharose 6 Fast Flow in 20 mM Tris–HCl (pH 7.4) and 0.1 M NaCl. The unbound fraction containing renin was buffer exchanged and loaded onto POROS S/20 (cat. no. 1-3022, Applied Biosystems) in 10 mM sodium acetate (pH 5.0) and 5.0 mM NaCl. Renin was eluted with a linear gradient to 1.0 M NaCl and was dialyzed versus 20 mM Tris–HCl (pH 7.0) and 0.1 MNaCl. Purified renin was concentrated to 12 mg ml-1 and stored at -70°C. Final yield was typically 0.2-0.4 mg crystallizable renin per liter of prorenin-containing media. Crystallization of recombinant human reninPurified renin was crystallized by the vapor-diffusion in hanging drop method. Equal volumes (2 μL) of mature renin (8-12 mg mL-1) and reservoir solution (10–20% polyethylene glycol [PEG] 3350, 50 mM sodium citrate [pH 4.5], and 0.6 M NaCl) were mixed and equilibrated at 20°C.15 The crystals belong to the cubic P213 space group with the unit cell dimension of approximately 141 Å. Suitable crystals (~0.25 mm on each face) were transferred into a fresh 4 μL hanging drop containing 2.5 mM compound dissolved in well solution with an additional 2-3% PEG 3350. The drop was incubated at 20°C, typically for 48 hours. The crystals were cryoprotected by transferring to a 4 μL drop of 20% ethylene glycol in well solution, and then immersed in liquid nitrogen.
Intensity data collection
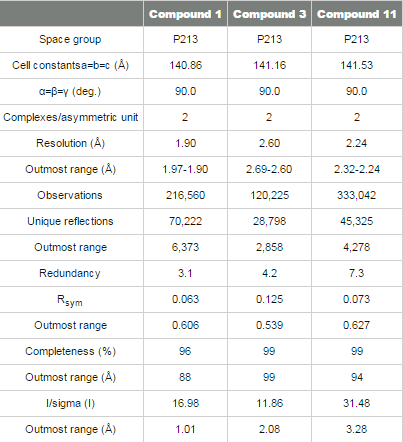
X-ray diffraction data of the renin complexes inhibited with compounds 1, 3 and 11 (Table 1) were collected at -180°C at the Advanced Photon Source facility on beamline 17-ID operated by the Industrial Macromolecular Crystallography Association. The crystals of compound 1 and 11 scattered X-rays to 1.9 and 2.25 Å resolution, respectively. The diffraction pattern from the crystal of compound 3 was considerably weaker, 2.6 Å resolution. Auto-indexing and processing of the measured intensity data were carried out with the HKL2000 software package.16 The intensity data collection statistics are summarized in Table 2.
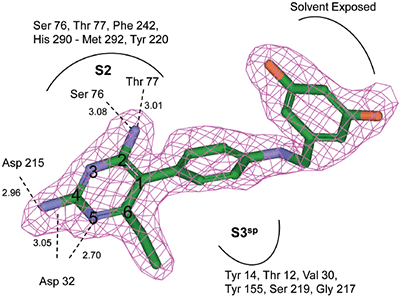
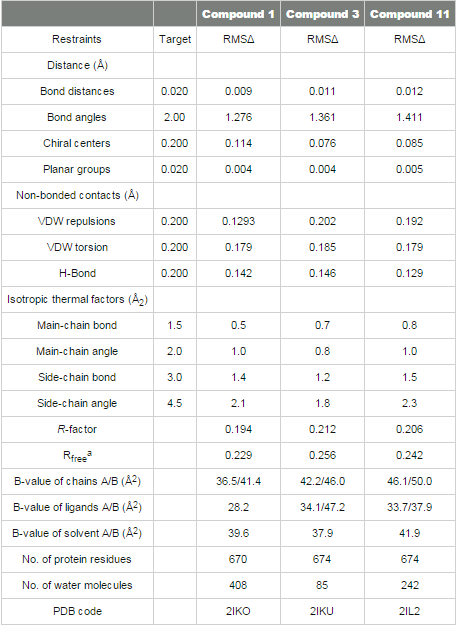
Structure determination and refinement The crystal structure of renin complexed with compound 1 was determined by molecular replacement using renin coordinates of the previously determined renin structure (PDB code 2I4Q) as an initial model. The rotation and translation searches were carried out with the MOLREP program,17 Collaborative Computational Project, Number 4. The rotation search provided two outstanding solutions with the Rfree/σ values of 8.54 and 5.68, corresponding to each of two molecules in the asymmetric unit related by a non-crystallographic 2 fold rotation axis. The position of one molecule was determined with a translation function that provided a R-value of 0.540 (score of 0.60); the second molecule improved the R-value to 0.482 (score of 0.704). The coordinates from the molecular replacement solution were further optimized by rigid-body refinement followed by slow-cooling simulated annealing and individual B-factor refinement using CNX 2002 (Accelrys).18 This decreased the Rwork and Rfree values to 0.194/0.229. Electron (2Fo-Fc) and difference (Fo-Fc) density maps were utilized for interactive fitting of protein structures into electron density using Coot19 and x-BUILD.20 Protein model building was alternated with coordinate minimization and individual B-factor refinement using Refmac 5.0.21 The parts of the protein structure that underwent conformational changes in respect to the initial model were fixed based on an analysis of the electron and difference density maps after deletion and then reconstruction. The calculated (2Fo-Fc) electron and (Fo-Fc) difference density maps showed well-defined electron density corresponding to the active site inhibitor, which was omitted from the calculations (Figure 1B). Placement of compound 1 to electron density was carried out with X-LIGAND (Accelrys).22 Solvent water molecules were added periodically based on examination of difference density maps using Coot and X-SOLVATE. Final protein coordinates were validated using PROCHECK.23

Crystal structures of renin complexed with compounds 3 and 11 were determined by the molecular replacement method. Renin coordinates from the refined structure of compound 1 were used as the starting model. Protocols and crystallographic software packages used in structure refinement and electron density fitting of complexes 3 and 11 were identical to those used in structure determination of renin complexed with compound 1. The OMIT (Fo-Fc) electron density map for compounds 3 and 11 are shown in Figures 3B and 4B. The final refinement statistics are presented in Table 3. aRfree is calculated for the 5% of the data that were withheld from refinement The coordinates of the structures have been deposited in the RCSB Protein Data Bank (compound 1, access PDB code: 2IKO; compound 3, access PDB code: 2IKU; compound 11, access PDB code: 2IL2).
Isothermal titration calorimetry
Isothermal titration calorimetry (ITC) experiments were performed using a MicroCal VP isothermal titrating microcalorimeter. Data collection, analysis and plotting were performed using a Windows-based software package (Origin, version 7.0) supplied by MicroCal. The titrating microcalorimeter consisted of a sample and reference cell held in an adiabatic enclosure. The calorimeter was calibrated by comparing the measured areas of applied heat pulses to known values. Known and experimentally measured values agreed to within 2%. To minimize heat of dilution effects resulting from differences in buffer composition between ligand and protein, ligands were dissolved in dialysate buffer from the final step in the renin purification. Ligand and protein solutions were degassed prior to analysis. The reference cell was filled with dialysate buffer. Since aqueous solubilities of ligands was poor, buffered renin at 300 μM was placed in a 250 μL syringe and 20 μM ligand was placed in the 1.375 mL sample cell. The concentration of renin was determined using an A280 of 1.06 for a 1 mg/mL solution. Typically, 30 injections, 4 μL per injection, of renin were made by a computer controlled injector into the sample cell filled with ligand solution. The syringe stir rate was 300 rpm. Heat adsorbed or released with each injection was measured by the calorimeter. Titration isotherms for the binding interactions were comprised of the differential heat flow for each injection. These were integrated to provide the enthalpy change with each injection. Heats of dilution obtained by injecting renin into final purification buffer were insignificant. Isotherms fit well to a single-site model using an iterative non-linear least-squares algorithm.11 All parameters were floated during the iterations.
Binding isotherms fit by this method provided the equilibrium association or binding constant, (Ka), the change in enthalpy, (ΔH), and stoichiometry of binding, (N). Binding stoichiometry was 1:1 within experimental error. The change in free energy (ΔG) and change in entropy (ΔS) were then determined using the following equation:

where R is the universal gas constant, T is the temperature in degrees Kelvin, and other parameters are as previously defined. >> Download the full Application Note as PDF
Malvern Instruments provides the materials and biophysical characterization technology and expertise that enable scientists and engineers to understand and control the properties of dispersed systems. These systems range from proteins and polymers in solution, particle and nanoparticle suspensions and emulsions, through to sprays and aerosols, industrial bulk powders and high concentration slurries. Used at all stages of research, development and manufacturing, Malvern’s materials characterization instruments provide critical information that helps accelerate research and product development, enhance and maintain product quality and optimize process efficiency. Our products reflect Malvern’s drive to exploit the latest technological innovations and our commitment to maximizing the potential of established techniques. They are used by both industry and academia, in sectors ranging from pharmaceuticals and biopharmaceuticals to bulk chemicals, cement, plastics and polymers, energy and the environment. Malvern systems are used to measure particle size, particle shape, zeta potential, protein charge, molecular weight, mass, size and conformation, rheological properties and for chemical identification, advancing the understanding of dispersed systems across many different industries and applications. Headquartered in Malvern, UK, Malvern Instruments has subsidiary organizations in all major European markets, North America, Mexico, China, Japan and Korea, a joint venture in India, a global distributor network and applications laboratories around the world. www.malvern.com severine.michel@malvern.com
Newsletters
Receive the latest pharmaceutical news, personalities, education, and career development – weekly to your inbox.