Executive summary
The combination of Dynamic Light Scattering (DLS) with Raman Spectroscopy provides the ability to extract a wealth of chemical, structural, and physical information about biotherapeutic proteins under formulation conditions.Raman spectroscopy simultaneously derives protein secondary structure (Amide I and III) and tertiary structure markers (aromatic side chains, disulfide bonds, hydrogen bonding, local hydrophobicity). These higher order structural determinations are performed at actual formulation concentrations (50 mg/mL or greater for mAbs), rather than at the lower concentrations required by conventional methods, i.e. less than a few mg/mL for Circular Dichroism (CD).
By use of Raman spectroscopy, protein secondary and tertiary structure perturbation/unfolding, melting temperature, onset temperature of aggregation, and van 't Hoff enthalpy values can all be derived, leading to improved understanding of competing pathways of unfolding/structure change and aggregation, and ultimately, unique insights into the mechanism(s) of aggregation to help improve formulation stability.
The unique coupling of Raman spectroscopy and DLS provides the ability to simultaneously correlate protein structure with colloidal parameters to enhance the understanding of protein therapeutic formulations under a variety of stress conditions, e.g., thermal, formulation, chemical degradation, extrinsic particulates.
Introduction
Raman spectroscopy derives information about protein secondary and tertiary structure by monitoring molecular vibrations. Dynamic light scattering (DLS) is a workhorse technique for determining the hydrodynamic diameter of biotherapeutic proteins in solution, in addition to their polydispersity and interactions. By combining these two analytical approaches into a single system, a wealth of chemical, structural and physical parameters can be determined. Protein secondary and tertiary structure, melting temperature, onset temperature of aggregation and transition enthalpy values can all be derived, as well as aggregation propensity, protein solubility, and the potential for high viscosity at formulated concentrations. The complementary nature of the results obtained from DLS and Raman spectroscopy on the same sample may provide unique insights into its unique mechanisms of aggregation and unfolding. Here we describe the role of Raman spectroscopy in understanding the conformational stability of protein therapeutics.The approach
Malvern Instruments’ Zetasizer Helix (ZS Helix) integrates a fiber-coupled Raman spectrometer with a Zetasizer Nano ZSP to provide DLS (colloidal stability) and Raman (conformational stability) data sequentially on a single sample. The Zetasizer Nano system integrates proprietary non-invasive backscatter (NIBS) detector technology with dynamic (DLS), static (SLS) and electrophoretic (ELS) light scattering to measure the hydrodynamic radius of proteins from 0.15 nm - 5 µm, from 0.1 mg/mL to ≥ 100 mg/mL. Raman spectra are collected using 785 nm excitation (~280 mW) from 150 cm-1 - 1925 cm-1 at 4 cm-1 resolution. Sample aliquots (~120 µL) are placed into a 3 mm quartz cuvette and positioned in a temperature-controlled compartment that provides temperature control from 0°C - 90°C ± 0.1°C. Thermal ramp studies are conducted by collecting Raman and DLS data over a series of pre-defined 0.1°C - 5°C step-wise increments. Isothermal incubation studies are conducted by collecting as series of Raman and DLS data over a pre-defined time interval at a desired temperature set-point.Results and Discussion
Higher order structure Secondary structure Raman spectroscopy is an effective approach to determine protein secondary structure characteristics. A variety of secondary structural determination algorithms have been suggested, including 1) band deconvolution of a particularly information-rich spectral feature called the Amide I band and 2) a multivariate modeling approach that incorporates a broad spectral range (~990 cm-1 to 1730 cm-1). The Amide I band, ~1600 cm-1 to 1700 cm-1, results mainly from the C=O stretch combined with a small amount of C-N stretch. The Amide III feature, ~1200 cm-1 to 1340 cm-1, results from coupling of the C-N stretch to the N-H bend. The overall shapes of these bands change with secondary structure. A band at ~930 cm-1 to 950 cm-1 is based on N-Cα-C skeletal stretching mode, and its intensity is indicative of α-helix content. The above features are the major characteristic bands of the protein secondary structure and are summarized in Table 1. Table 1: Correlation between Raman shift and protein secondary structure.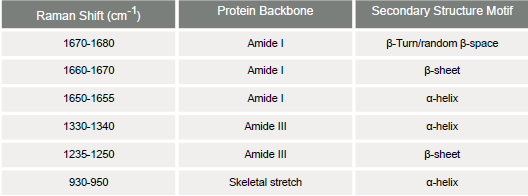
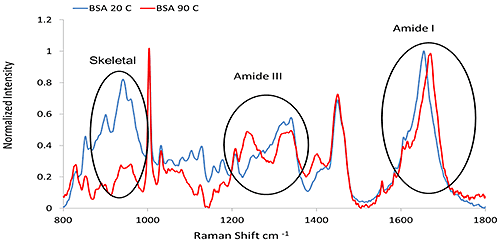
Figure 1 presents representative Raman spectra of BSA (Bovine Serum Albumin) before and after thermal treatment, highlighting the major secondary structure features described above. In this example, the clear transition from an α-helix rich structure into a β-sheet abundant structure is evident. A variety of analyses (e.g. spectral deconvolution, second derivative) can be applied to the Amide I, III, and skeletal stretching regions for detailed analysis of secondary structure. These approaches will be covered in future technical notes.
A multivariate approach, on the other hand, considers the entire spectral profile, not just a single Raman band or frequency. In this approach, spectral and structural data from a representative number of proteins is used to create a PLS model that can predict protein structures on unknown proteins, i.e. those not contained within the library. The data presented in Table 2 demonstrate the type of structural information that can be derived from this model automatically, along with comparison to reported values from www.pdb.org. Table 2: Secondary structural motifs derived from a multivariate analysis of Raman spectra of proteins, as compared to PDB reported values.
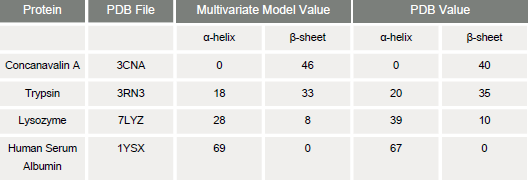
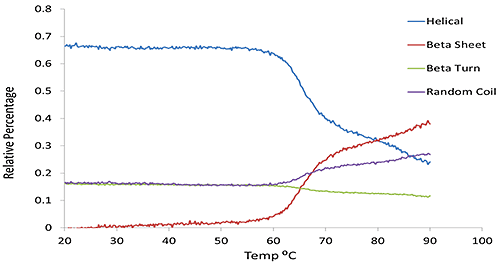
Figure 2 compares α-helical and β-sheet content predicted via the multivariate model as a function of temperature for the same set of BSA data shown in Figure 1. It clearly shows the secondary structure changing as the temperature increases; this is chiefly an increase in β-sheet and random content, while α-helix drops significantly.
>> Download the full Application Note as PDF
Malvern Instruments provides the materials and biophysical characterization technology and expertise that enable scientists and engineers to understand and control the properties of dispersed systems. These systems range from proteins and polymers in solution, particle and nanoparticle suspensions and emulsions, through to sprays and aerosols, industrial bulk powders and high concentration slurries. Used at all stages of research, development and manufacturing, Malvern’s materials characterization instruments provide critical information that helps accelerate research and product development, enhance and maintain product quality and optimize process efficiency. Our products reflect Malvern’s drive to exploit the latest technological innovations and our commitment to maximizing the potential of established techniques. They are used by both industry and academia, in sectors ranging from pharmaceuticals and biopharmaceuticals to bulk chemicals, cement, plastics and polymers, energy and the environment. Malvern systems are used to measure particle size, particle shape, zeta potential, protein charge, molecular weight, mass, size and conformation, rheological properties and for chemical identification, advancing the understanding of dispersed systems across many different industries and applications. Headquartered in Malvern, UK, Malvern Instruments has subsidiary organizations in all major European markets, North America, Mexico, China, Japan and Korea, a joint venture in India, a global distributor network and applications laboratories around the world. www.malvern.com severine.michel@malvern.com
Newsletters
Receive the latest pharmaceutical news, personalities, education, and career development – weekly to your inbox.